Plot real-time data with Python
I am involved in a project to create a tensile tester for a friend. I have never used a tensile tester myself so I have to play by ear here. But it occurred to me that not much more than a strong 1-dimensional axis would be needed. So we built a mock-up using a stepper motor, some old guides from a sliding door and threaded rod connected to both the motor shaft and a nut that was soldered to the moving carriage.
The second part of the contraption was to set a load cell on one end so a test piece could be fixed between the load cell and the moving carriage. As the carriage pulls away from the load cell, the specimen response could be measured and graphed.
Using an Arduino was the obvious choice this time, as it was, in fact, the only choice, given my friend is building this thing at home, three thousand miles away from me and we all are under covid19 lockdown. He only had one Arduino Mega at home, so that is what we will use.
I thought that specimen test data could just be sent to a PC and stored in a file. That file could be later displayed as a graph. However, I felt not getting any feedback while a test is being performed and having to wait until it was over to get a sense of what happened was not very nice. So I set my mind to the task of graphing the data as it was being received from the Arduino board.
I created a simple set of commands in the Arduino so the PC program could be sending several commands to the controller board to start and stop a test, as well as to receive the measured data, set the motor speed, and so on.
On the PC side, I wanted to do something that could, hopefully, work on my friend's laptop, that was running Windows 10 as well as on my iMac, running OSX. Java was one possible candidate, but I have been using Python lately for some other projects. Both languages can be used in the two computers freely. I had a look and Python's Matplotlib and I liked it a lot, so Python it was.
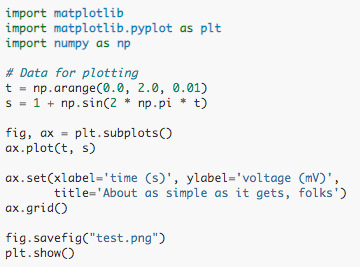
But, as usual, the devil is in the details, and while I could create a nice graph with not much effort in Matplotlib, I quickly realized that most of the examples were about pushing data onto the library and then calling the show() method to create a new window with a beautiful graph you can interact with (pan, zoom, and save as a graphics file), as for example shows the code below:


The second part of the contraption was to set a load cell on one end so a test piece could be fixed between the load cell and the moving carriage. As the carriage pulls away from the load cell, the specimen response could be measured and graphed.
Using an Arduino was the obvious choice this time, as it was, in fact, the only choice, given my friend is building this thing at home, three thousand miles away from me and we all are under covid19 lockdown. He only had one Arduino Mega at home, so that is what we will use.
I thought that specimen test data could just be sent to a PC and stored in a file. That file could be later displayed as a graph. However, I felt not getting any feedback while a test is being performed and having to wait until it was over to get a sense of what happened was not very nice. So I set my mind to the task of graphing the data as it was being received from the Arduino board.
I created a simple set of commands in the Arduino so the PC program could be sending several commands to the controller board to start and stop a test, as well as to receive the measured data, set the motor speed, and so on.
On the PC side, I wanted to do something that could, hopefully, work on my friend's laptop, that was running Windows 10 as well as on my iMac, running OSX. Java was one possible candidate, but I have been using Python lately for some other projects. Both languages can be used in the two computers freely. I had a look and Python's Matplotlib and I liked it a lot, so Python it was.
But, as usual, the devil is in the details, and while I could create a nice graph with not much effort in Matplotlib, I quickly realized that most of the examples were about pushing data onto the library and then calling the show() method to create a new window with a beautiful graph you can interact with (pan, zoom, and save as a graphics file), as for example shows the code below:

The problem with this code is that data is statically pushed to the library with the plot() command and the graph is shown when shown() method is called.
But a bit of browsing around led me to this page in StackOverflow, where a simple way to refresh a graph with new data was shown. It all boils down to the use pause() method calls. As while the graph is usually shown the show() method is called, it will be too with these other calls. The main difference here is that pause(seconds) only shows the graph for a limited time, the number of seconds passed as a parameter in the call, while the show() method will show the graph and block program execution till the graph window is closed. However, there is still a subtle detail, after the elapsed time of seconds have passed, the graph is not hidden, but it remains visible on the screen. The time specified only determines how long the execution of the pause command is going to last. So a small value can be used for getting a responsive graph, that can update several times per second.
But ... what about the data? Well, fortunately, there is set_data() method that will allow the program to update the data, so if new information is available it can be added to the data array to be shown. But to access that you will need to get access to the data points with a call to subplots() to get a handle of the axis and next to plot() to get a handle of datapoints. The net result is the user can see how the graph line "grows" as a test is being performed, which was exactly what I was after.

Sample code for that graph:


Comments